Redesigning and rebranding pnsn.org
Timeline:
Role:
Description:
July 2019 - October 2021
User Researcher, UX Designer, Visual Designer
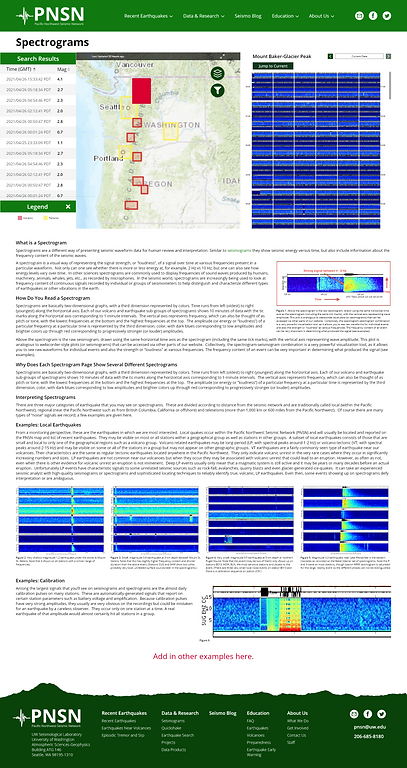
A complete redesign of the Pacific Northwest Seismic Network's branding and website, pnsn.org, to improve legibility, consistency, and access to information both online and offline.

The Problem
The Pacific Northwest Seismic Network's (PNSN's) website has a wealth of information for scientists and the general public. However, it is confusing to navigate through, and the amount of information can be overwhelming. The design and branding of the website also feels dated and some design patterns do not match users expectations.
Background
The Pacific Northwest Seismic Network (PNSN) is the regional seismic network for Washington and Oregon. They operate all of the seismic sensors within the region, analyze the seismic data, and report that data to the public. The main way they report this data is through pnsn.org, the public facing website operated by the PNSN. Pnsn.org is the main point of contact for a lot of people in Washington and Oregon to view recent earthquakes, use various products, and look at information about earthquakes and volcanoes.
.png)

.png)
Research
In order to determine areas of improvement within the current website, usability testing was conducted. Participants were those who had previously accessed pnsn.org and used the internet daily. There were three main sections of the sessions.
Card Sorting Activity
Determine users mental model around the information on pnsn.org
Ranking Activity
Determine how users prioritize information available on pnsn.org
Three Tasks
Determine the usability and ease of navigation of pnsn.org
.jpg)
.jpg)
Task 1
“You are at the University of Washington in Seattle, and think you’ve just felt an earthquake. You decide to go to pnsn.org to look at your location and the recent earthquakes to learn if you just felt an earthquake.”
Seven participants completed usability testing sessions.
1
2
3
4
5
6
7
Approximate age: 48 years old
6/7
Visit and use pnsn.org 1-2 days per week.
7/7
Have previously used pnsn.org
7/7
Use the internet for at least 1 hour per day.
I completed affinity analysis on the qualitative data available.
.jpg)
.jpg)
.jpg)
I also completed analysis on the quantitative data collected. This included sorting and ranking data, as well as Likert scale data.
How enjoyable was your experience?
.png)
5
4
3
2
1
Not
2
3
4
Very
How usable did you find pnsn.org?
.png)
5
4
3
2
1
Very Difficult
2
3
4
Very Easy
I found pnsn.org ...
5
4
3
2
1
.png)
Very Disorganized
2
3
4
Very Organized
The information on pnsn.org engaged my interest.
5
4
3
2
1
.png)
Strongly Disagree
2
3
4
Strongly Agree
It was easy to find the information on pnsn.org.
5
4
3
2
1
.png)
Strongly Disagree
2
3
4
Strongly Agree
Research Findings
My findings were split into three categories, with three findings per category. These categories include organization, information, and presentation.
Current & Recent information is the most important information, and is what users commonly use the website for.
“I want to know what's happening and what's going to happen”
“First thing I’m going to look for is what’s just happened or is currently happening”
7/7
Said that Task 1 (finding recent earthquakes) is mot similar to how they use the website.
The site is unorganized and users find it hard to navigate.
“I had to go through several places each time to find what I wanted and I'm familiar with the site”
“I feel like I'm going on a bit of a treasure hunt”
“I can never find what I'm looking for the first time around”
Users have trouble finding information, and want specific information highlighted.
“I want to know historical information about [the monroe earthquake] but I don't know where to find that”
“I go to USGS maps for recent earthquakes before PNSN. NEIC has historic activity and beach balls”
“Have something on homepage reminding people to be prepared in an emergency”
Users enjoy having access to a lot of information and trust PNSN as a source.
“I enjoy having all the information readily available”
"Feels like there's a lot of data behind it"
"If I was gonna look for more resources I'd come here first cause it'd give quality resources"
The amount of information available can be overwhelming.
"My first thing looking at this - and I don't even have it all out - is that there are too many"
"Wow you got a lot here"
"There's a lot of data there - work could be done to consolidate a lot of information"
There is a disconnect between what users care about and what scientists care about.
"I want to keep science accessible to people so they have access"
"As an end user, some of the data doesn't speak to me"
"This is really in depth data [waveforms and seismograms]"
Some labels don’t make sense to users. They seem too scientific and organization focused.
“Outreach - from the point of view of the organization it might make sense but to the public it doesn't”
“Query is too scientific”
“Earthquakes is a very general navigation title”
Users gravitate towards visual representations of data, whether that's maps, pictures, or data tables.
“I’m kind of a map person”
“These pictures make me feel like it's really talking about something”
“I like the data tables personally”
The site’s function does not match users' expectations.
“I thought I was gonna zoom in but it took me to a separate page”
“if I click it sorts! I would not have guessed that cause the mouse gives a typing cursor instead of a pointer finger”
“I expected clicking on the list would highlight the map”
Information Architecture
With many of the findings being around navigating the site, having trouble finding information, and feeling like the amount of information is overwhelming, our team took a look at the information architecture.
.jpg)
.jpg)
Taking the findings from the sorting activity, different topics were categorized into three main sections - organization information, data & products, and educational information. After discussions with stakeholders, pages were merged and categorized into the four main navigational headers.
The previous architecture was indeed overwhelming and confusing. The navigation at the top of the page changed when a user clicked into a sub area of the website. There were many pages with only a few sentences of content.
The fourth category, Recent Earthquakes, was added based on user feedback that recent information and data is often the most important to the users.
Wireframes
I sketched out a few screens to get a feel for how the navigation of the different sections would work.


After sketching out wireframes, I started experimenting with how the homepage should be laid out. This required a bit of experimenting because I wanted to move away from the blocks of content in the existing website, but deciding how to show the vertical map of Washington and Oregon without it appearing blocky proved complex.


I drew inspiration from some existing website's designs, including the cutout of the mountain, navigation between pages, overlapping of elements, and the footer.


Visual Design
After determining the general layout of the site, I began focusing on the rebranding of PNSN.
The existing logo did not fit well in limited horizontal spaces, such as a website header. Additionally, there was not existing brand guidelines on voice, symbols, colors, text, logo use, and photo use.
My goal was to create a logo and icon that could be used in a variety of situations.


The Solution
High Fidelity designs were created to handoff to the developer. Unfortunately, I am no longer employed at the Pacific Northwest Seismic Network and these designs have not been implemented.


Reflection
I was happy with my decision to pursue usability testing of the existing website. I had to pitch to stakeholders, who had very little knowledge of what UX research is, the importance of user research. I believe I did so successfully and was also able to communicate with stakeholders the research findings in ways that clicked with their frame of thinking.
This project spanned part of the pandemic, which required alterations in my workflow and affected how I communicated with stakeholders. This ended up being a challenge for getting feedback from stakeholders, increasing timelines. If I was to go back and do anything differently, I would improve these communication channels.

